Increase Marketing ROI with Customer Segmentation
Introduction
Customer segmentation is an important part of a marketing campaign. The goal of this project was to apply machine learning techniques to identify segments of the population that form the customer base for a mail-order sales company. By analyzing and finding the right customer segments, the company will be able to launch direct marketing campaigns for a high ROI. The data was provided by Bertelsmann Arvato Analytics Group.
Executive Summary
The project started with data cleansing. The data cleansing component took 80% of the time of the project. During data cleansing missing values were dropped, and mixed-type features were split and scaled. Once the data was in proper shape, Principal Component Analysis (PCA) was applied to reduce the dimensionality. After PCA, the data was ready to be used to find the right amount of clusters with the Elbow Method. When the right amount of clusters was found, the training and prediction phase began. During the prediction phase, important insights were discovered. Particularly, which type of customers would generate the highest marketing ROI and which type of customers should be avoided. By discovering the segments, the mail-order company is now ready to launch the direct-marketing campaigns that will drive the highest ROI.
Results
The underlying population dataset size was around 891,221 rows. Almost half of the data, 438,128 rows, were removed due to missing values. The other 453,093 data points were used to generate clusters for the segmentation. Kmeans was chosen as a clustering algorithm with a total of 19 clusters. Once the clustering was finished, the following insights could be derived from the data:
The over-represented kind of people in the customer base were people between 46-60 years old, males, with a high monthly income and low movement patterns (change in place of residence).
The under-represented kind of people in the customer base were people between 30-45 years old, females, with very low income and high movement patterns.
From information obtained, the direct-marketing campaigns should target people between 46-60 years old, males with high income and low movement patterns.
Project Overview
The first part of the project was about data cleansing. According to IBM, 80 percent of a data scientist’s time is spent on finding, cleansing, and organizing data. This rule applies to the current project. As already mentioned in the results section, half of the data was removed during the evaluation part. It’s the fastest approach to not needing to deal with missing data. A better strategy is to impute or to infer the missing values. But since there was enough data, the impute strategy was discarded to simplify the project. Figure 1.0 shows an overview of missing values by columns. Some of the columns contain more than 40% missing values, and those columns were discarded.
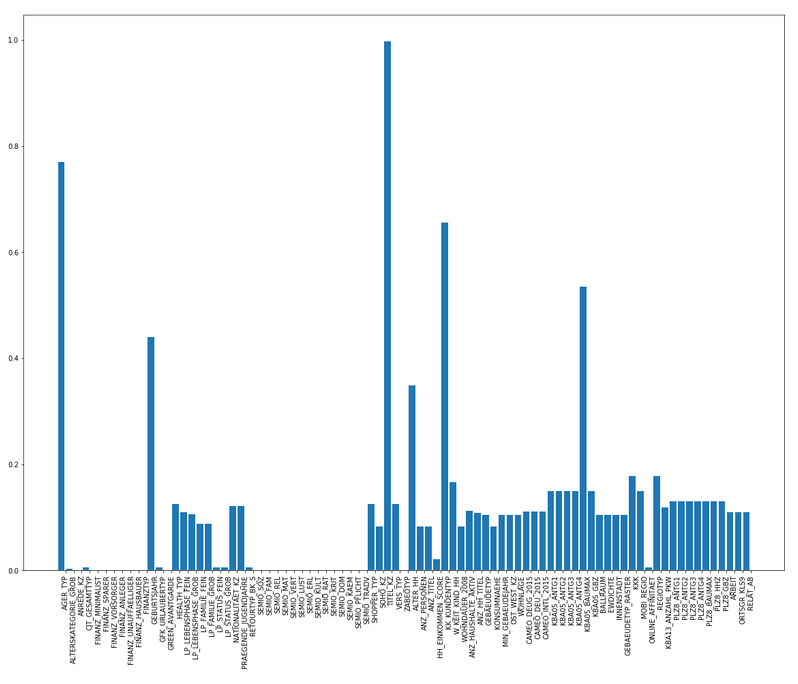
Figure 1.0: Missing values by columns overview
Once the columns with more than 40% of missing values were removed, a similar strategy was applied to rows. Rows that contained any missing values, were removed from the evaluation too. The final result was 453,093 rows that were used for further examination.
The next part of the project was about selecting and re-encoding the features. It’s an inevitable part of any machine learning project because most of the algorithms work on data that is encoded numerically. Only categorical data was encoded based on a lookup table provided by Arvato. Ordinal, numeric and interval data was kept without changes. Some mixed-type features were also split into new variables, and by doing so it was possible to have better granularity for the learning part. Figure 1.1 shows an overview of the mixed-type features. PRAEGENDE_JUGENDJAHRE and CAMEO_INTL_2015 were split into WEALTH and LIFE_STAGE. Once this was completed, the feature scaling was applied.

Figure 1.1: Mixed-type Features Overview
After feature scaling, there was a need to perform dimensionality reduction. For this project, principal component analysis PCA was used to perform dimensionality reduction. The goal was to reduce the number of features to increase the speed. As well, PCA can improve the accuracy of the machine learning models, by creating components (latent features) that are generated from features that contain the most variance in the data. The decision was made to choose 116 principal components. Figure 1.2 shows the percentage of explained variance by principal components.

Figure 1.2: Explained Variance per Principal Component
The principal component analysis was the last part of the data cleansing part of this project. Once completed, the data was ready to apply machine learning techniques to build the clusters. Kmeans was chosen as the main unsupervised algorithm for clusterization. Due to constraints in time and computational resources, the number of clusters was set to 19. Figure 1.3 shows the Elbow Method.

Figure 1.3: Elbow Method SSE vs. K
Where SSE is the distance from the centroid to the data points and K the amount of clusters. The Elbow Method shows the optimal number of clusters for the best classification. Equipped with the hyper-parameters, the training process was started. After training the model, the following distribution of customers among clusters was made, see Figure 1.4.

Figure 1.4: Distribution among the Clusters for Customers
The first chart shows customers distributed by clusters. Y-axis shows the percentage of customers that were distributed among the clusters (x-axis). The second chart shows the German population distributed by clusters. Y-axis shows the percentage of persons distributed among the clusters (x-axis). Figure 1.4 clearly shows that cluster 1 is overrepresented and cluster 12 is underrepresented. It means that the core customer base of the mail-order sales company are persons from the 1st cluster and not the persons from the 12th cluster. Further investigation shows that the 1st segment contains persons that are 46 - 60 years old, male, with high income and low movement patterns. The 12th cluster contains persons that are 30-45 years old, female, with very low income and high movement patterns. Movement pattern means changing the place of residence.
Conclusion
Based on the findings, the conclusion can be made that the most valuable customer segment consists of persons that are male, older than 46 years with high income. To achieve the best possible ROI for the direct marketing campaigns, the company should focus on males over 46 years with high income and low movement patterns and 30-45 year old women with low income and high movement patterns.
Recommendations
The insights generated during the project could be obtained differently e.g. through observations, or another type of analysis. This method, focussing on the customer segmentation based on machine learning clustering algorithms does it within a very short period of time. In a couple of days, an analyst with machine learning skills can uncover many important insights that would be possibly overseen during manual data analysis. Also some of the smaller segments not covered in this report could play an important role to increase the revenue and improve the ROI.
Due to time and computational constraints, it was not possible to optimize the hyper-parameters. To fine-tune the model, this kind of optimization should be undertaken. The code was rewritten from a jupyter notebook and can be launched from the command line interface. The project was developed during the machine learning program at Udacity. The code is not covered by unit tests, and there are no plans for further refactoring.